


This article was automatically translated from the original Turkish version.
+2 More
Satellite imaging systems play a critical role in remote sensing applications. In these systems, spectral resolution defines which bands of the electromagnetic spectrum a sensor can detect and is an important factor in image analysis. Sensors with higher spectral resolution can distinguish between different types of materials and land cover more precisely by collecting data in narrower band intervals. Spectral resolution can be achieved through hyperspectral and multispectral imaging systems. The spectral resolution of satellite imagery is used in fields such as environmental monitoring, agricultural analysis, and disaster management by enhancing the ability to differentiate between various surface materials.
Satellite sensors collect data across different spectral bands. These bands are generally classified as follows:
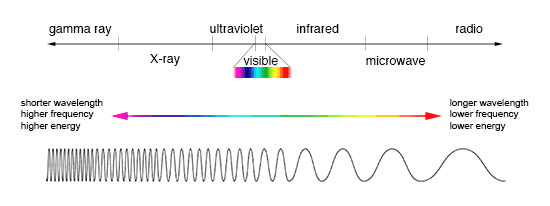
Electromagnetic Spectrum Schematic-Atay
This method typically collects data in 3 to 10 bands. Satellites such as Landsat, Sentinel-2, and Landsat 8 use multispectral sensors. Multispectral imaging enables the identification of basic surface materials by gathering data over broad spectral ranges.
Hyperspectral sensors collect data in over 100 bands across the electromagnetic spectrum, enabling detailed analysis of material types. They are most commonly used in mining, agriculture, water quality monitoring, and military applications. Hyperspectral images allow for precise material discrimination by analyzing specific spectral signatures.
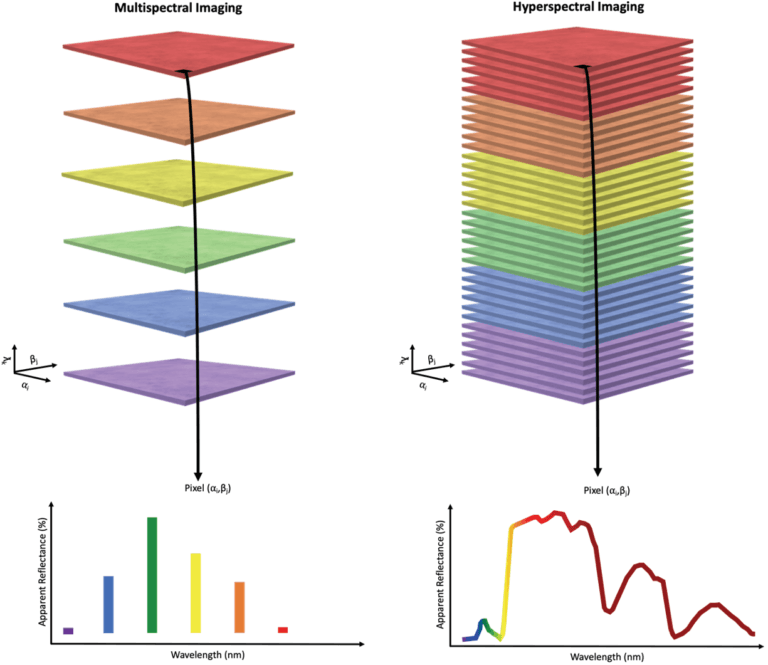
Difference Between Multispectral and Hyperspectral Bands- Solmaz Babakan
Panchromatic imaging captures data in a single broad spectral band—typically encompassing the entire visible spectrum—to produce high spatial resolution black-and-white images. Panchromatic images are particularly useful in mapping and city planning applications where fine detail must be clearly discerned. In satellite imaging systems, panchromatic and multispectral images are often combined through a process called “pansharpening” to produce images with both high spatial and high spectral resolution.
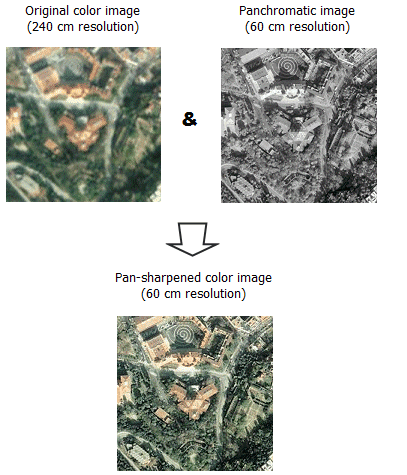
Pansharpening Application - Esri
Plant health assessment, crop type identification, and measurement of agricultural productivity rely on spectral resolution. Hyperspectral imaging, in particular, offers significant advantages in the early detection of diseases and optimization of agricultural inputs.
Fire risk mapping and detection of forest diseases are conducted using spectral resolution. Applications such as tree species identification, biomass estimation, and evaluation of carbon stocks are enabled by data provided through spectral resolution.
Water pollution, algal blooms, and the physical-chemical properties of water can be analyzed using spectral data. For example, chlorophyll-a concentration can be determined using hyperspectral imagery, contributing to water quality assessment.
Spectral resolution plays a critical role in monitoring and detecting damage from natural disasters such as forest fires, floods, and droughts. Thermal infrared bands are used to identify fire-affected areas and detect active fire zones.
Atay Mühendislik. "Hiperspektral ve Multispektral Görüntüler." Atay Mühendislik Blog. November 12, 2023.Accessed Adresi
Campbell, J. B., and Wynne, R. H. Introduction to Remote Sensing. Guilford Press, 2011.
Esri. "Fundamentals of Panchromatic Sharpening." ArcGIS Desktop, 2021.
Jensen, J. R. Remote Sensing of the Environment: An Earth Resource Perspective. Pearson Education, 2007.
Lillesand, T., Kiefer, R. W., and Chipman, J. Remote Sensing and Image Interpretation. Wiley, 2015.
Mather, P. M., and Koch, M. Computer Processing of Remotely Sensed Images: An Introduction. Wiley, 2011.
Richards, J. A. Remote Sensing Digital Image Analysis: An Introduction. Springer, 2013.
Solmaz Babakan. "Uzaktan Algılama ve Uydu Haberleşme." 2023.Accessed Adresi.

No Discussion Added Yet
Start discussion for "Spectral Resolution in Satellite Images" article
Spectral Resolution and the Electromagnetic Spectrum
1. Visible Region (VIS)
2. Near-Infrared (NIR) and Infrared (IR)
3. Thermal Infrared (TIR)
4. Microwave
Multispectral, Hyperspectral, and Panchromatic Imaging
Multispectral Imaging
Hyperspectral Imaging
Panchromatic Imaging
Applications of Spectral Resolution
Agriculture
Forestry
Water Resources and Hydrology
Natural Disaster Analysis