This article was automatically translated from the original Turkish version.
The ">Production Possibilities Curve, also known as the ">Transformation Curve in economics, is a curve that illustrates the alternative production shares of two different ">goods or sectors within an economy using the same factors of production. The production possibilities curve is a geometric representation showing how, under given technology and fixed resources, an economy can most efficiently and at the lowest cost utilize its available resources.
This curve incorporates three fundamental elements: scarcity, choice, and ">opportunity cost. The "unattainable ">region" indicates that resources are limited and that production combinations within this area are impossible. "Choice" refers to selecting among the attainable alternatives.
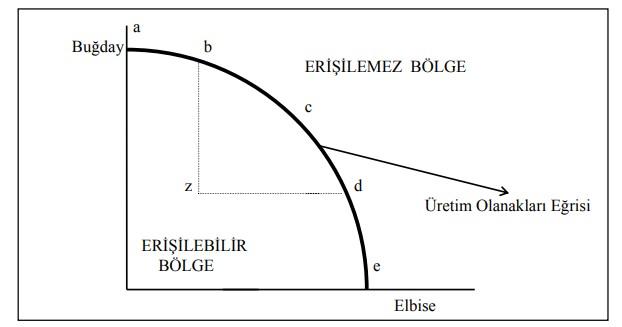
">Production Possibility Frontier-There is always a preferred point on the curve. Points on the curve offer greater opportunities than any point within the attainable region.
Each point on the curve, such as a, b, c, d, or e, represents a different set of ">choice options. These points provide greater production opportunities compared to other points within the attainable region. However, preferring one point over another may sometimes raise issues of preference. For example, consider preferring point c over point b. At point c, more clothing can be produced than at point b, but less ">food will be produced. This illustrates the concept of ">opportunity cost.
Opportunity Cost: Choosing one option typically means giving up another alternative. When you increase the production of one good, you must sacrifice production of another. This trade-off is opportunity cost. Selecting one alternative requires forgoing the best alternative, and the value of that forgone alternative is called the opportunity cost. The negative slope of the curve reflects the increasing magnitude of opportunity cost. The more of one ">good produced, the higher the corresponding opportunity cost, because increasing production of one good necessitates sacrificing more of the other.
Demir, Ö. 2005. "Mikroiktisadın Temel Kavramları: Üretim Olanakları Eğrisi ve Ekonomik Verimlilik." Gazi Üniversitesi İktisat Çalışmaları 19 (1): 33-47.
Ertürk, H., and H. Çelik. 2015. "Üretim Olanakları Eğrisi ve Fırsat Maliyeti İlişkisi Üzerine Bir Değerlendirme." İktisat ve Toplum Dergisi 5 (3): 45-58.
Uğurlu, C. 2012. "Üretim Faktörlerinin Etkin Kullanımı ve Üretim Olanakları Eğrisi İlişkisi." Dokuz Eylül Üniversitesi İktisadi ve İdari Bilimler Fakültesi Dergisi 27 (2): 88-102.
No Discussion Added Yet
Start discussion for "Production Possibility Frontier" article
Key Characteristics of the Production Possibilities Curve