


This article was automatically translated from the original Turkish version.
Power BI
Full Name | Power BI (Business Intelligence) | ||||||||
|---|---|---|---|---|---|---|---|---|---|
Developer | Microsoft Corporation | ||||||||
Initial Release | July 2015 | ||||||||
Category | Project Management Tool | ||||||||
Scope | Business Intelligence and Data Visualization Software | ||||||||
Core Component | Power BI Mobile (Mobile Applications) Power BI Report Server (On-Premises Server) Power BI Report Builder (Paginated Reports) Power BI Service (Cloud Service) Power BI Desktop (Desktop Application) | ||||||||
Last Release Date | May 5, 2025 | ||||||||
Current Version | 2.142.1277.0 | ||||||||
File Name | PBIDesktopSetup_x64.exe, PBIDesktopSetup.exe | ||||||||
File Size | 778.2 MB, 728.9 MB | ||||||||
Power BI is a cloud- and desktop-based business intelligence platform that enables data acquisition, processing, modeling, and interactive visualization. Power BI is a business intelligence and data visualization software developed by Microsoft. It allows users to collect data from a wide variety of sources, analyze it, visualize it, and share insights. Power BI is an integrated system comprising a desktop application (Power BI Desktop), an online service (Power BI Service), and mobile applications. It is widely used in corporate analytics processes such as decision support systems, business performance monitoring, and project management.
The origins of Microsoft’s data analysis and visualization tool Power BI lie in components such as Power Pivot in Excel, Power Query (Data Explorer), and Project Crescent / Power View in SQL Server. For example, a press announcement in October 2011 revealed that the first interactive visualization tool, named “Project Crescent,” was introduced as part of SQL Server 2012. In 2013, Microsoft integrated this suite of tools into the Office 365 service under the name “Power BI.” Subsequently, Power BI evolved into a cloud-based BI platform and was released as an independent solution on 24 July 2015, including Power BI Service, Power BI Desktop, and mobile applications. Since that date, Microsoft has continued releasing monthly updates for both Power BI Desktop and the service, adding new features each month. As of April 2025, it is documented that Power BI Desktop receives regular updates monthly.
Power BI, (Microsoft)
In subsequent years, Microsoft introduced the Power BI Premium plan. Announced in May 2017, Premium offered a capacity-based licensing model that delivered enhanced performance for large-scale deployments. This license also enabled on-premises deployment using the Power BI Report Server. Over time, Power BI has evolved into a feature-rich platform with capabilities such as data storytelling, intelligent Q&A, AI-driven content recommendations, and paginated reports.
The latest version of Power BI Desktop, with version number 2.142.1277.0, was released on 5 May 2025. This version includes bug fixes and performance improvements based on user feedback. Specifically, issues such as misclassification of user errors, unreported unsaved edits, and errors during concurrent file opening have been resolved.
Power BI Desktop is updated regularly every month. Microsoft provides support only for the latest version; therefore, users are advised to use the most recent version before requesting support.
Power BI is an integrated ecosystem composed of multiple components. These include:
Power BI, (Microsoft)
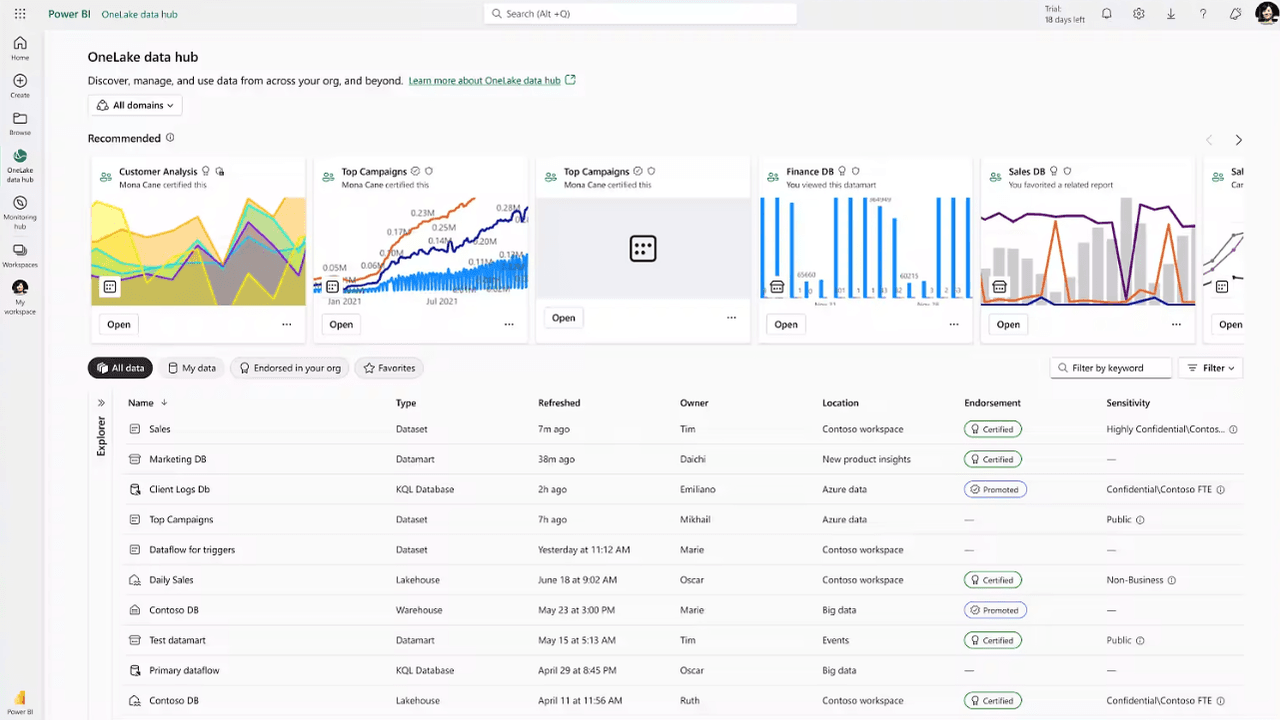
The general workflow among these components is as follows: Data retrieved from sources in Power BI Desktop is transformed using Power Query and a data model is created (including relational tables, DAX calculations, etc.). The resulting reports are published to Power BI Service. The service operates on Azure infrastructure and can either store data in the cloud or interact with existing infrastructure such as SQL Server Analysis Services or Azure Analysis Services. To connect to on-premises data sources, the Power BI Gateway is used. Users can view these reports and dashboards via web or mobile applications. Additionally, reports can be integrated into external applications through APIs such as Power BI Embedded. In summary, Power BI is built on an architecture that gathers and analyzes data from any source and includes rich visualization and sharing layers.
One of Power BI’s key features is its data transformation and preparation capabilities. Power BI uses the Power Query engine to extract data from hundreds of sources (Excel, SQL databases, web services, Azure services, etc.) and perform powerful preprocessing (ETL). According to Microsoft, Power Query provides connectivity to “hundreds of data sources” and over 350 transformation steps per source. This allows users to easily define and save reusable operations such as data cleaning, merging, and filtering through a visual interface. Power BI also enables real-time querying of data through DirectQuery and Live Connect modes. After creating a data model, users can meet analytical needs by defining custom measures (calculated columns and metrics) using DAX (Data Analysis Expressions) formulas.
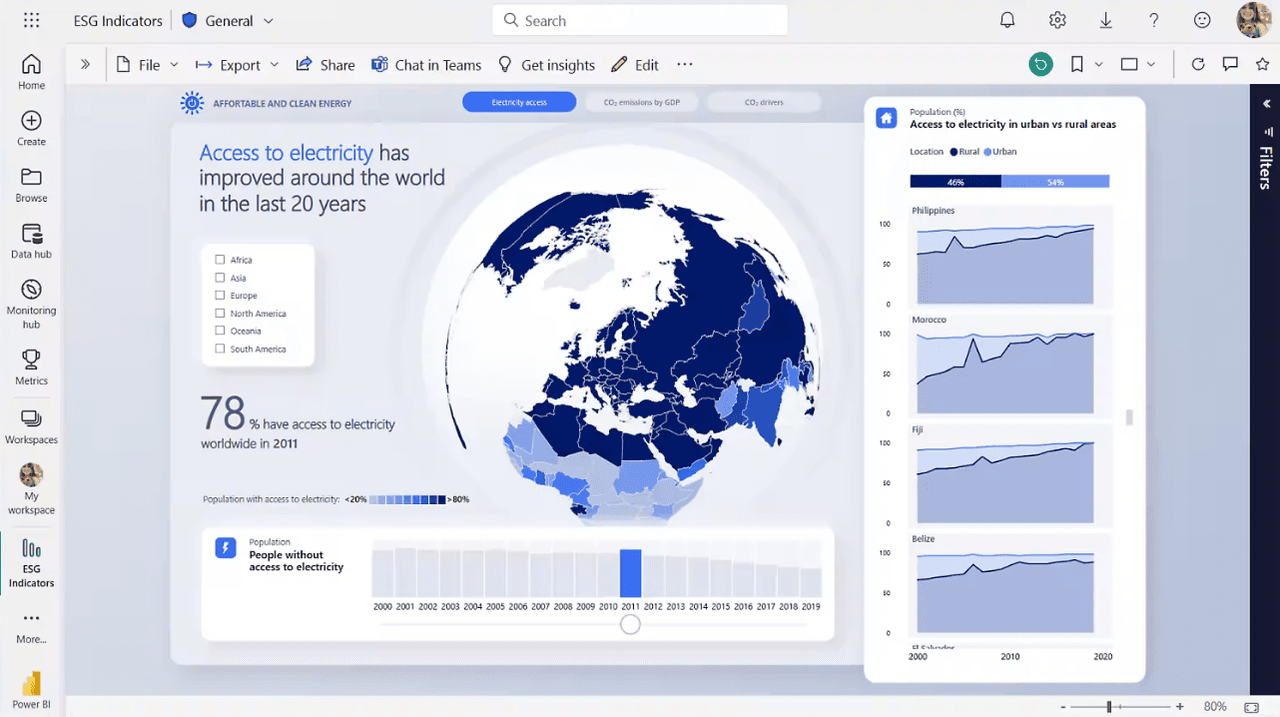
For visualization, users can select from a wide range of built-in visuals such as line, column, pie, map, matrix/table, KPI, treemap, and scatter plots to create reports. Additionally, custom visuals provided by developers and the community can be added. Report pages are interactive: selecting an item in one chart automatically filters other charts. Power BI also offers a natural language Q&A feature, allowing users to type questions about their dataset in their own words and receive visual responses. Real-time data visualization (streaming) and subscription notifications are also supported, enabling continuous updates of reports with live data. Ultimately, Power BI delivers a complete analytics experience from data preparation and model creation to designing interactive charts and dashboards.
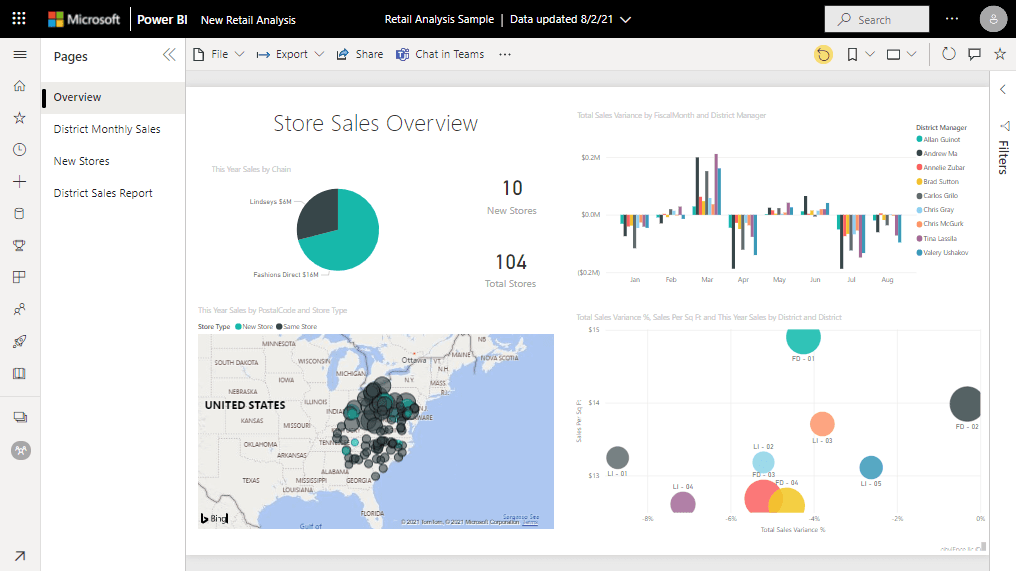
Power BI is used across nearly every industry and enterprise scale to meet business intelligence needs. Organizations in finance, marketing, sales, manufacturing, healthcare, education, public sector, and telecommunications choose Power BI to build data-driven decision support systems. For example, applications such as revenue and expense analysis, customer segmentation, production efficiency measurement, and IoT sensor data analysis can be managed using Power BI dashboards. Thanks to its cloud-based architecture, Power BI can integrate and monitor data from both on-premises sources and services such as Azure, SharePoint, and Dynamics 365.
Power BI, (Microsoft)
In project management, Power BI is also used to visualize project progress and performance. Microsoft provides data templates to analyze Project Online and “Project for the web” data with Power BI. For example, using a Microsoft Power BI template, task, resource, and schedule data from Project Online can be retrieved from Microsoft Dataverse and visualized as charts to display core metrics of project portfolio management (PPM). In this way, indicators such as project timelines, budget utilization, and delays are monitored on interactive reports. Overall, Power BI’s easy-to-use report and dashboard interfaces help project stakeholders track real-time performance and make strategic decisions.
Power BI’s licensing structure is subscription-based.
Power BI Desktop can be downloaded and used completely free of charge. Every user accessing the cloud service must have either a Free, Pro, or Premium Per User (PPU) license. The Free license provides full functionality for personal report creation but has limited collaboration features; at least a Pro license is required to share content within an organization. The Pro license (monthly fee per user) offers report publishing, collaboration, and sharing capabilities. For enterprise needs, Power BI Premium offers capacity plans (P SKU) and Premium Per User (PPU) options. With Premium, organizations receive dedicated cloud resources that allow unlimited user access; the Power BI Report Server is also included in Premium packages. Since 2017, differences between the free service and Pro have been reduced: free accounts now have nearly the same data source access as Pro, but sharing features remain exclusive to Pro users.
Power BI’s integration capabilities are extensive. Through its Power Query infrastructure, it supports numerous data sources. For example, direct connections can be established to Excel files, SQL Server, Oracle, SAP HANA, Azure SQL, Azure Data Lake, Salesforce, Google Analytics, OData feeds, and many more. These connections operate in either live (DirectQuery) or import mode. Additionally, Power BI can be integrated into custom applications via REST APIs and its embedding (Embedded) infrastructure. As Microsoft explains, Power BI Embedded and service APIs are unified into a single API surface, enabling developers to easily embed reports into their own applications. Power BI also integrates with Microsoft Teams, Outlook, and Office to support enterprise collaboration. For instance, the Power BI app can be added to Teams channels to display reports, and dynamic connections can be established with Office applications.
Power BI is frequently compared with business intelligence tools such as Tableau and Qlik Sense/View. While all these platforms offer analytics and visualization, they differ in strengths and cost models. In Gartner’s 2016 BI Magic Quadrant report, Microsoft (Power BI) was positioned as a leader, with Tableau (Salesforce) and Qlik also typically appearing among leaders. Generally, Power BI’s cost/accessibility advantage stands out: unlike other products, Power BI offers a free entry tier and affordable Pro/PPU options. In contrast, Tableau is known for its visual design and interactivity features, while Qlik is recognized for its in-memory data processing engine and non-relational data discovery capabilities. Organizations consider integration capabilities, total cost of ownership, and user experience when making their selection.
Cook, Jessica. “Happy First Birthday to Power BI!” Microsoft Power BI Blog, July 25, 2016.https://powerbi.microsoft.com/en-us/blog/happy-first-birthday-to-power-bi/
Hathi, Kamal. “Microsoft Accelerates Modern BI Adoption with Power BI Premium.” Microsoft Power BI Blog, May 3, 2017.https://powerbi.microsoft.com/en-us/blog/microsoft-accelerates-modern-bi-adoption-with-power-bi-premium/
Microsoft. "Licenses and Subscriptions for Business Users." Microsoft Learn, July 29, 2024.https://learn.microsoft.com/en-us/power-bi/enterprise/service-premium-per-user-faq
Microsoft. "Microsoft Expands Data Platform With SQL Server 2012, New Investments for Managing Any Data, Any Size, Anywhere." Microsoft News, October 12, 2011.https://news.microsoft.com/2011/10/12/microsoft-expands-data-platform-with-sql-server-2012/
Microsoft. "Power BI Data Sources." Microsoft Learn, September 6, 2024.https://learn.microsoft.com/en-us/power-bi/connect-data/desktop-data-sources
Microsoft. "Power BI: Pricing Plan." Microsoft Power Platform. Accessed May 18, 2025.https://powerbi.microsoft.com/en-us/pricing/
Microsoft. "Previous Monthly Updates to Power BI Desktop and the Power BI Service." Microsoft Learn, April 22, 2025.https://learn.microsoft.com/en-us/power-bi/fundamentals/desktop-change-log
Microsoft. "What Is Power BI?" Microsoft Learn, March 22, 2024.https://learn.microsoft.com/en-us/power-bi/fundamentals/power-bi-overview
Microsoft. "What Is Power Query?" Microsoft Learn, January 27, 2025.https://learn.microsoft.com/en-us/power-query/power-query-what-is-power-query
Microsoft. “Proje Verileriniz ile Bağlantı Kurmak İçin Power BI Desktop’ı Kullanın.” Microsoft Destek. Accessed May 18, 2025.https://support.microsoft.com/tr-tr/office/proje-verileriniz-ile-bağlantı-kurmak-için-power-bi-desktop-ı-kullanın-df4ccca1-68e9-418c-9d0f-022ac05249a2.

Power BI
Full Name | Power BI (Business Intelligence) | ||||||||
|---|---|---|---|---|---|---|---|---|---|
Developer | Microsoft Corporation | ||||||||
Initial Release | July 2015 | ||||||||
Category | Project Management Tool | ||||||||
Scope | Business Intelligence and Data Visualization Software | ||||||||
Core Component | Power BI Mobile (Mobile Applications) Power BI Report Server (On-Premises Server) Power BI Report Builder (Paginated Reports) Power BI Service (Cloud Service) Power BI Desktop (Desktop Application) | ||||||||
Last Release Date | May 5, 2025 | ||||||||
Current Version | 2.142.1277.0 | ||||||||
File Name | PBIDesktopSetup_x64.exe, PBIDesktopSetup.exe | ||||||||
File Size | 778.2 MB, 728.9 MB | ||||||||
Development History and Version Evolution
Core Components and System Architecture
Power BI Desktop System Requirements
Minimum Requirements
Recommended Requirements
Core Features and Functions
Features:
Use Cases and Role in Project Management
Areas of Use:
Project Management:
Licensing Model and Integration Capabilities
Integration:
Comparison with Similar Tools